
6# - 3 ways to structure a semi-self-service Power BI model
Balancing IT and Business roles in data curation and report creation

Reading time: 7 minutes
In our previous article, we explored how a semi-self-service Power BI implementation model can help companies deliver faster, more maintainable reports.

Background
I should admit that, for clarity, I simplified the business team's report creation steps.
But that’s not a problem: we will see the details here. To make things super clear, the image below highlights the specific part of the process we'll focus on in this article.
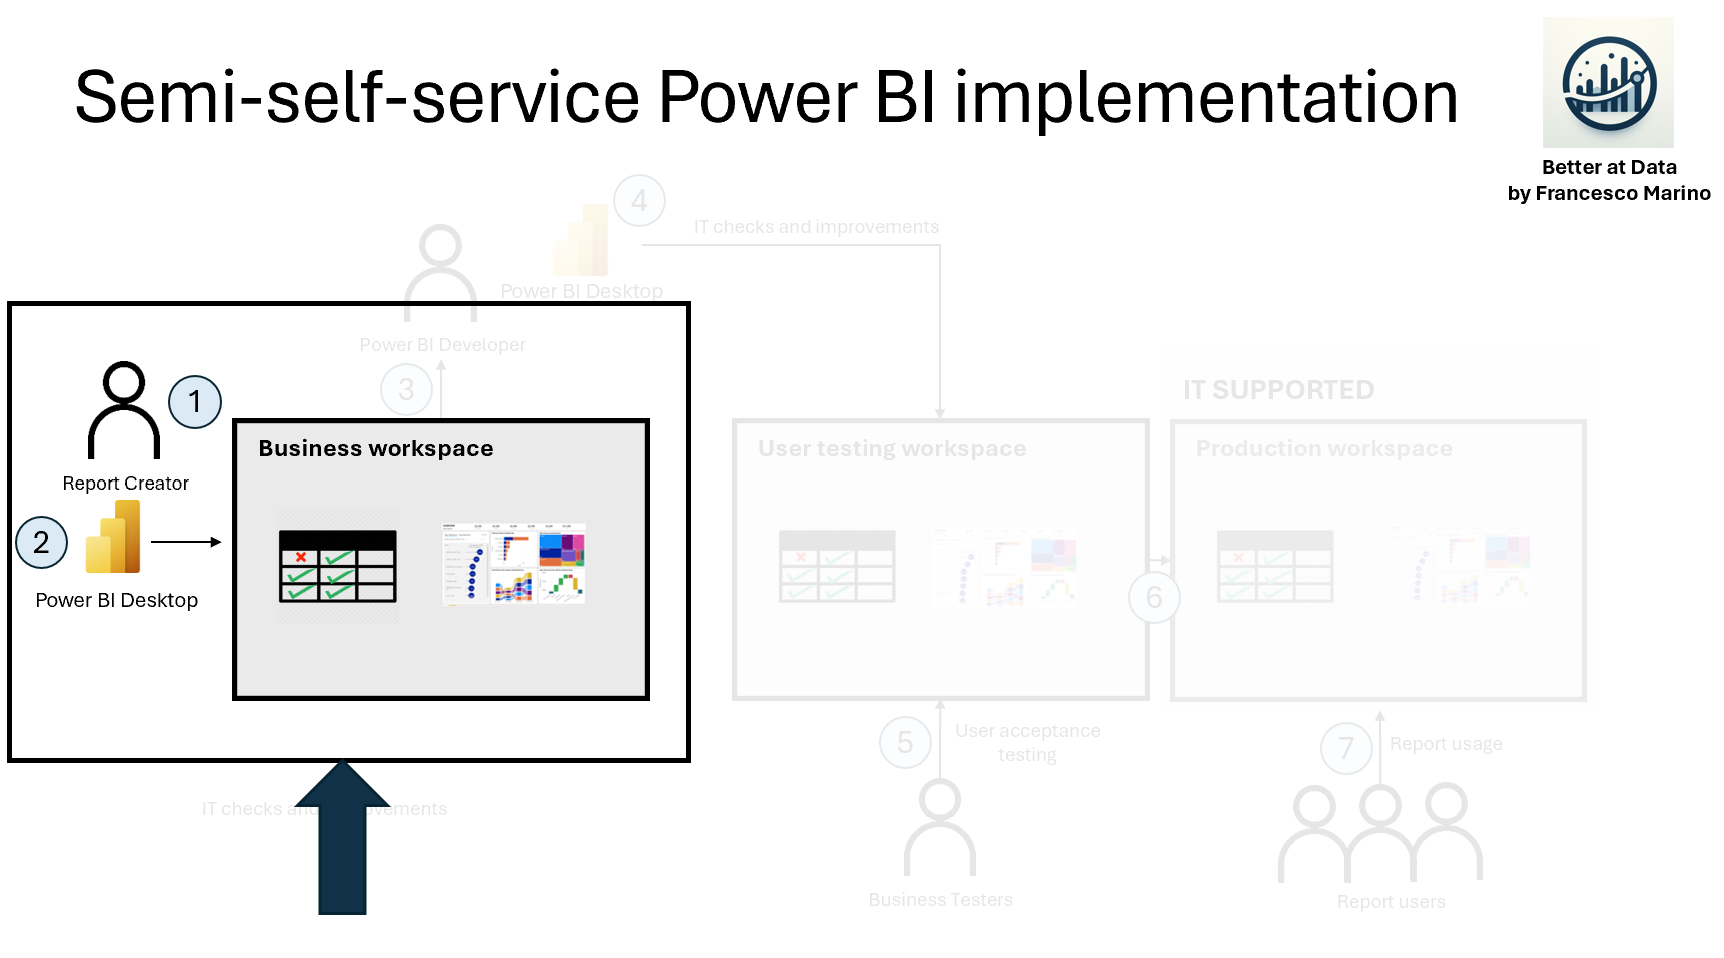
This highlighted process can be implemented in various ways. I've used two main criteria to define three possible approaches:
Which team does curate the data: IT or business?
How complex is the report?
Let’s analyse these criteria.
Which team does curate the data: IT or business?
In this context, "data curation" refers to the process where a person or team technically creates a Power BI semantic model. Data curation can be also done with Dataflows for example, but with some important differences. Just keep it in mind.
In large organizations, data curation is typically handled by either the IT team or the business team.
IT normally curates the data when:
The data cleaning process is used for critical use cases.
Data are hosted in Data Warehouses, Data Lakes and similar components where technical knowledge is required for the data querying/cleaning.
Business users do not have direct access to the required data.
Business teams normally curate data when:
Excel extracts or SharePoint lists are used as data sources.
The business team has data technical skills (e.g. SQL) and knows well the data source.
How complex is the report?
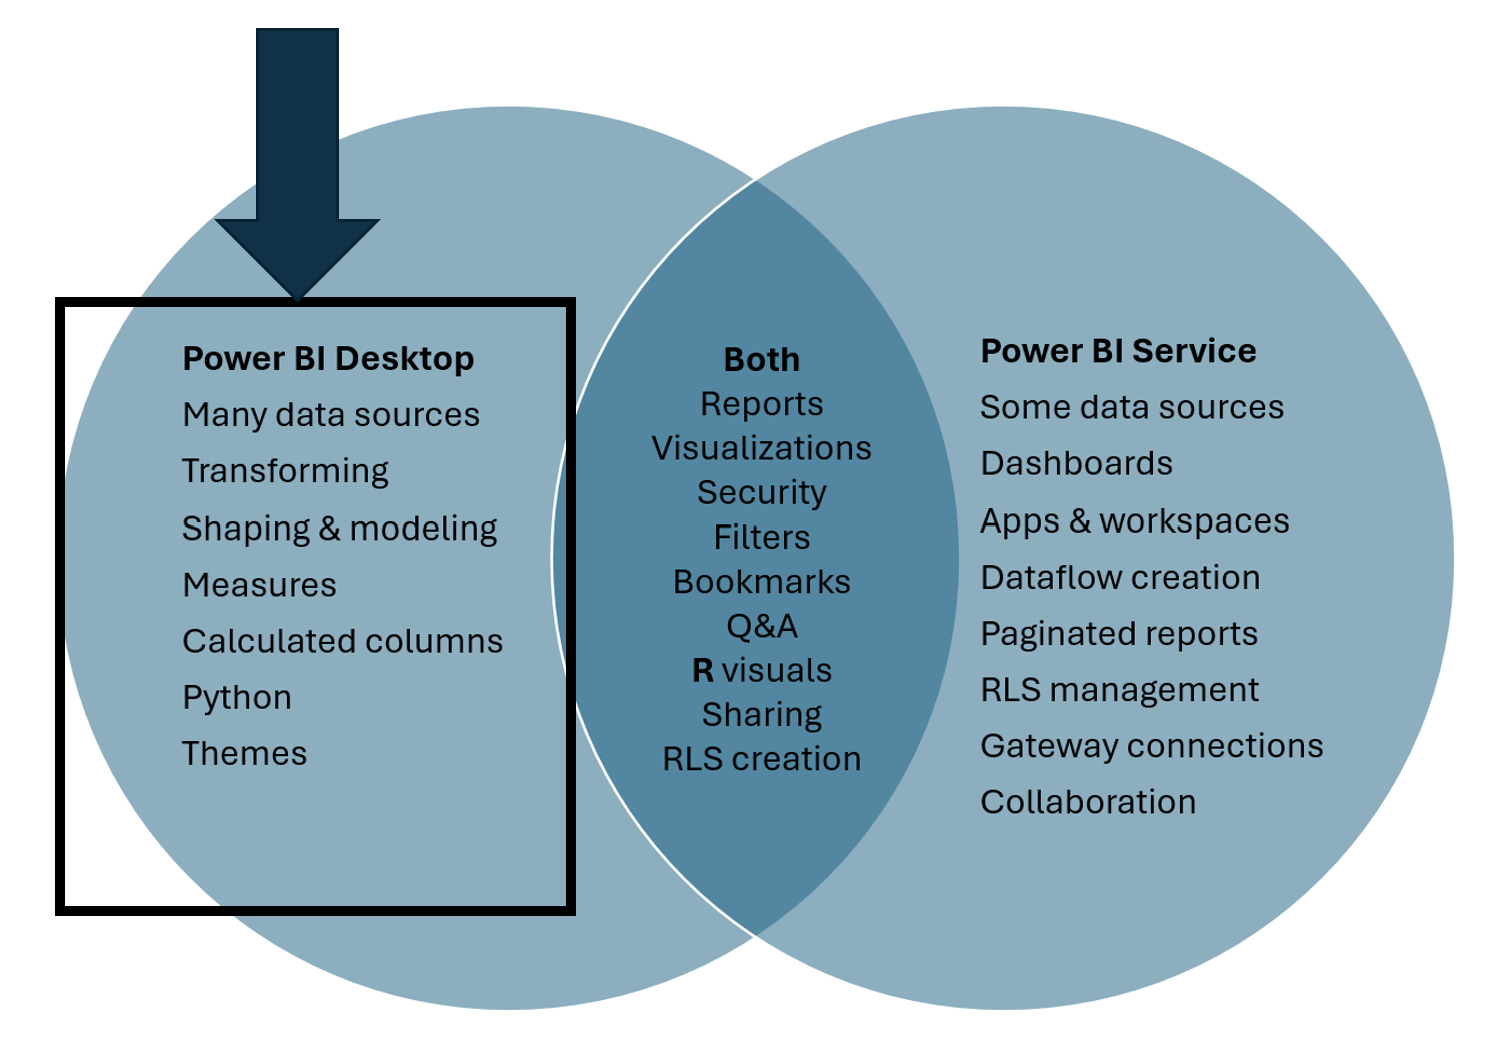
In this case, “complex reports” are those requiring Power BI Desktop functionalities, which are not available in Power BI Service. In most cases, these functionalities are measures, calculated columns, and themes.
You can see which functionalities are currently not available in Power BI Service in the picture below from the Microsoft Learn website.
3 ways to implement this model
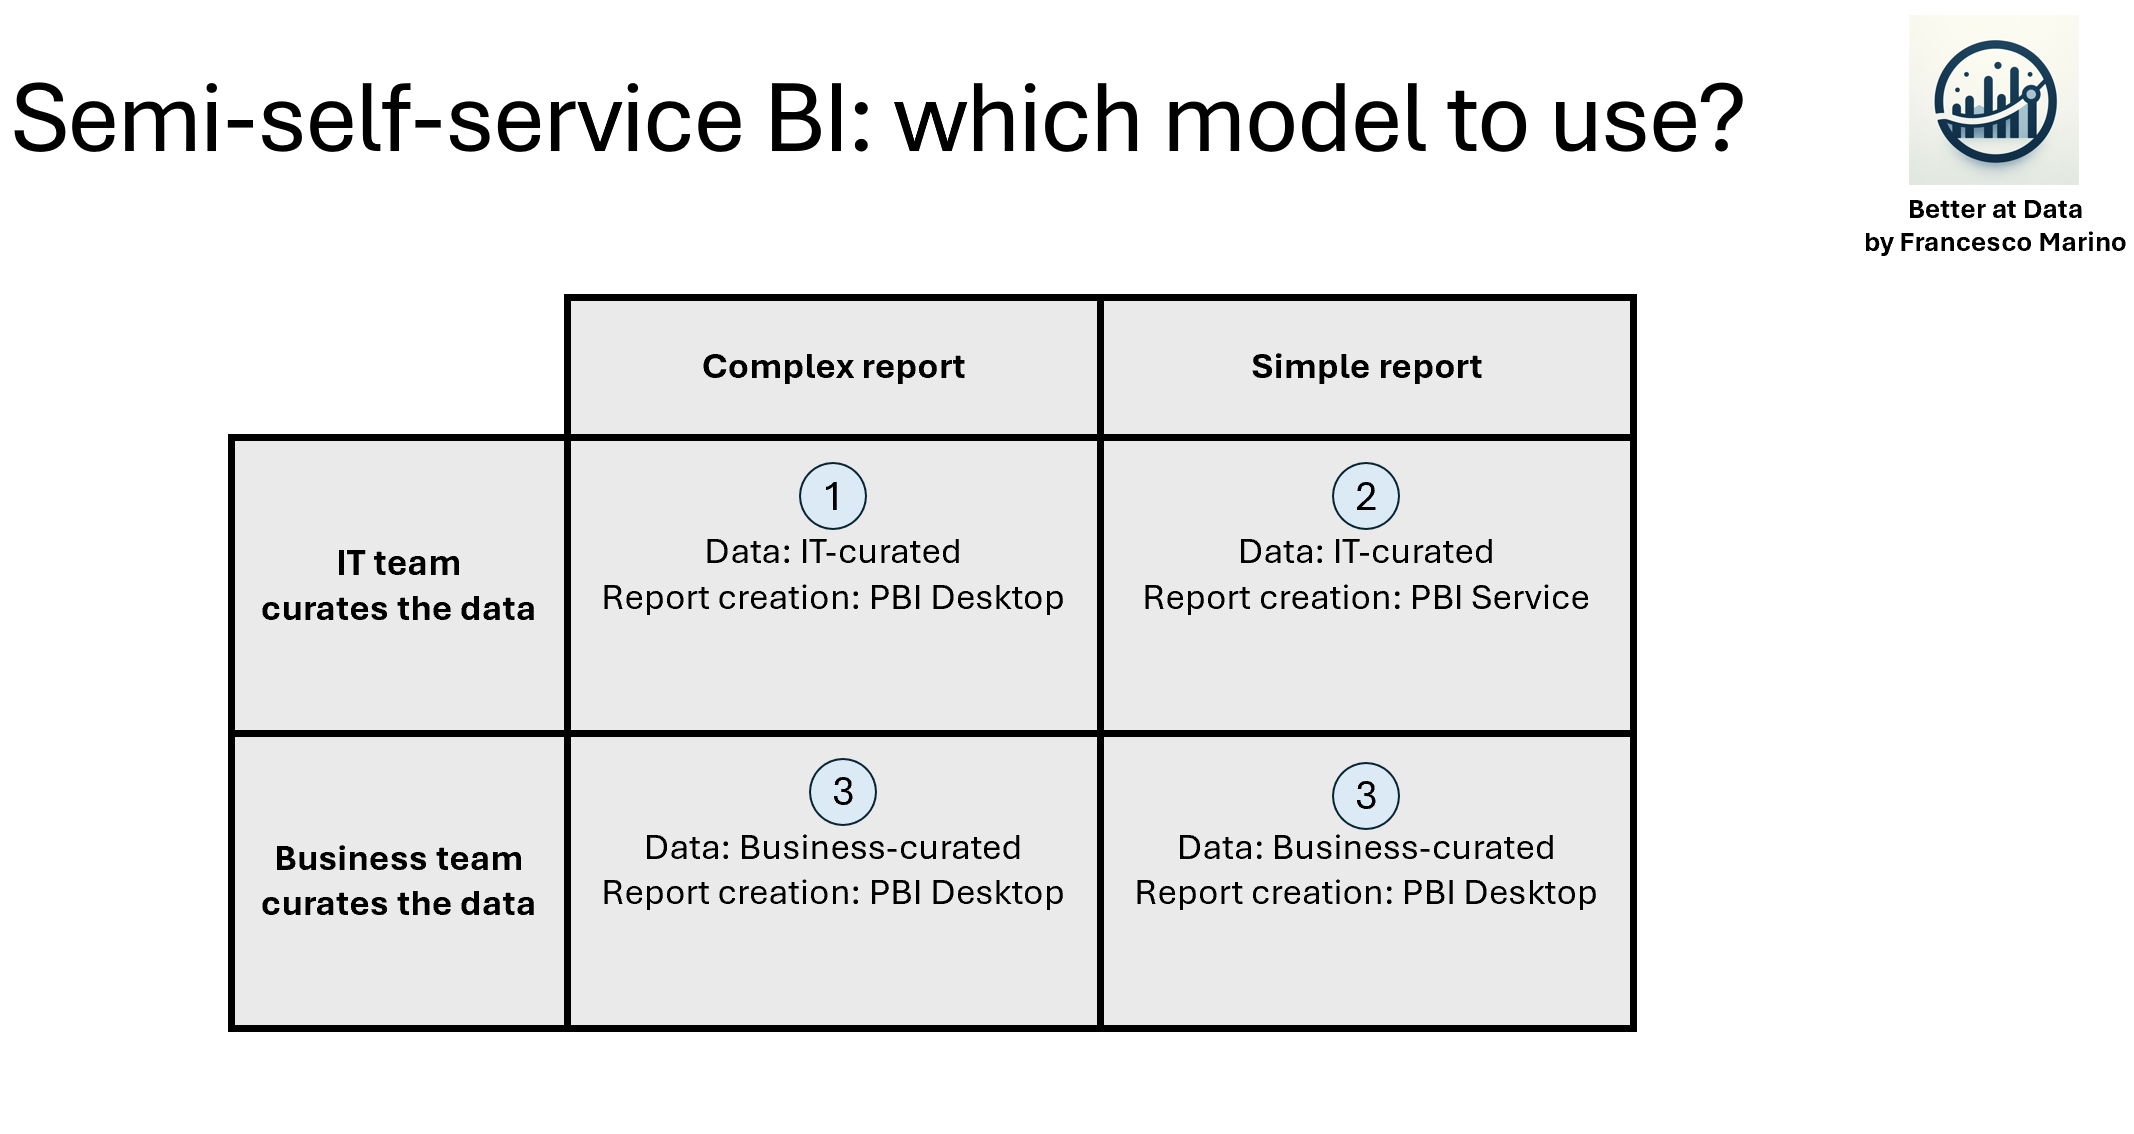
Starting from these two criteria, I identified three ways how you can handle this part of the semi-self-service implementation model:
IT-curated data + Power BI Desktop
IT-curated data + Power BI Service
Business-curated data
You can decide which of these ways to use according to the information in the table below.
Of course, these are 3 examples of how you can structure this part of the development process. Other ways are possible too but let’s focus on these three possible setups.
Before we jump on the cases let's review some key definitions.
The roles and the business workspace definitions were already discussed in these sections of the latest article: Roles and responsibilities - Why a business workspace?
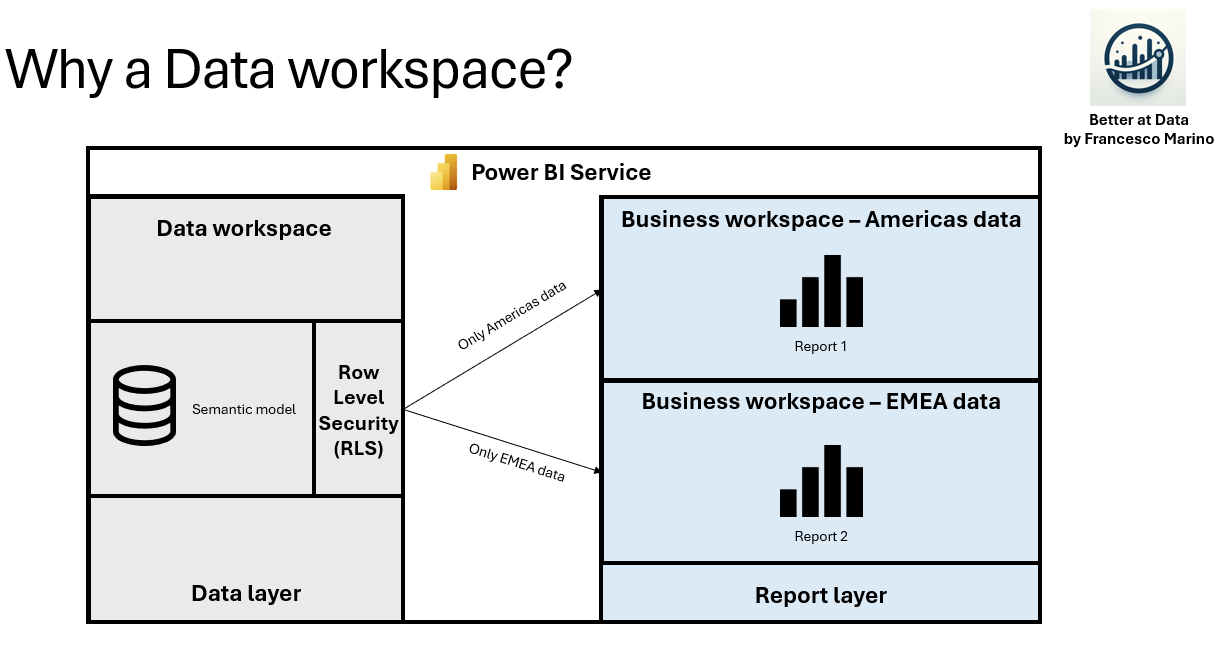
Now, let's introduce the concept of a 'Data workspace'.
The Data workspace is the Power BI workspace where the IT team hosts the prepared data in semantic models. Separating the Data workspace from the Business workspace offers several advantages by separating data and report layers:
We can grant report creators the ability to build report only with the subset of data they should access with Row Level Security. At the same time, we can give them full freedom in publishing and sharing the reports they create in the business workspace.

We can give IT team the full ownership on the centralized data layer that they develop and maintain. At the same time, we restrict access to read only in the business workspace owned by the report creators.
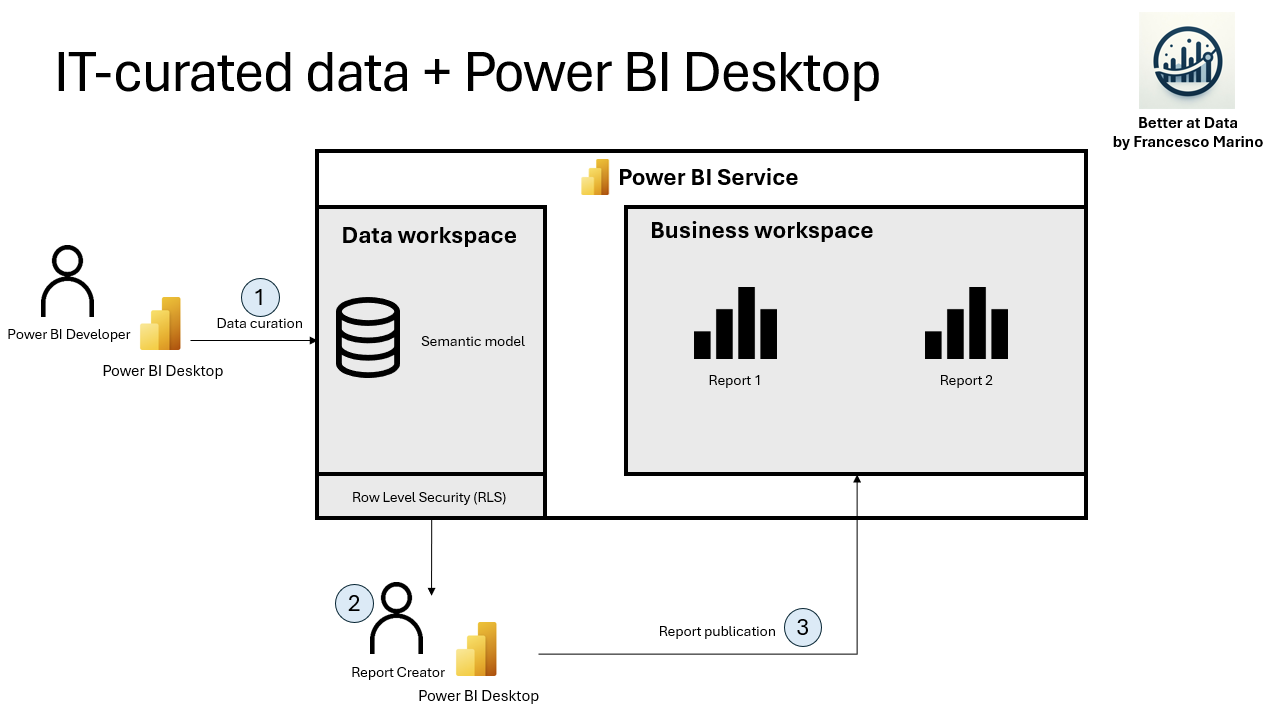
Case 1: IT-curated data and Power BI Desktop for report creation
This setup is ideal when the IT team curates the data and the reports are complex enough to require Power BI Desktop for creation.
The process involves the following steps:
The Power BI developer builds a semantic model and publishes it in the “Data workspace”.
The report creator uses the semantic model in Power BI Desktop to create a new report.
The report creator publishes the report in the “Business workspace”.
The diagram below illustrates these steps.
To implement this setup, I suggest you the following settings on the workspace access management and Semantic model permissions.
The Power BI developer should have:
Member or Admin right in the data workspace
This allows full freedom of sharing semantic models with the required report creators.Viewer right in the business workspace
Needed to understand how data are used and limiting any ability to perform changes in a non-IT-owned workspace.
The report creator should have:
Build permission with Row Level Security applied to the semantic model in the data workspace
Needed to be able to consume a semantic model to build a new report.Member or admin right in the business workspace
Needed to publish the created reports from Power BI Desktop in Power BI Service and to share the reports with other users.
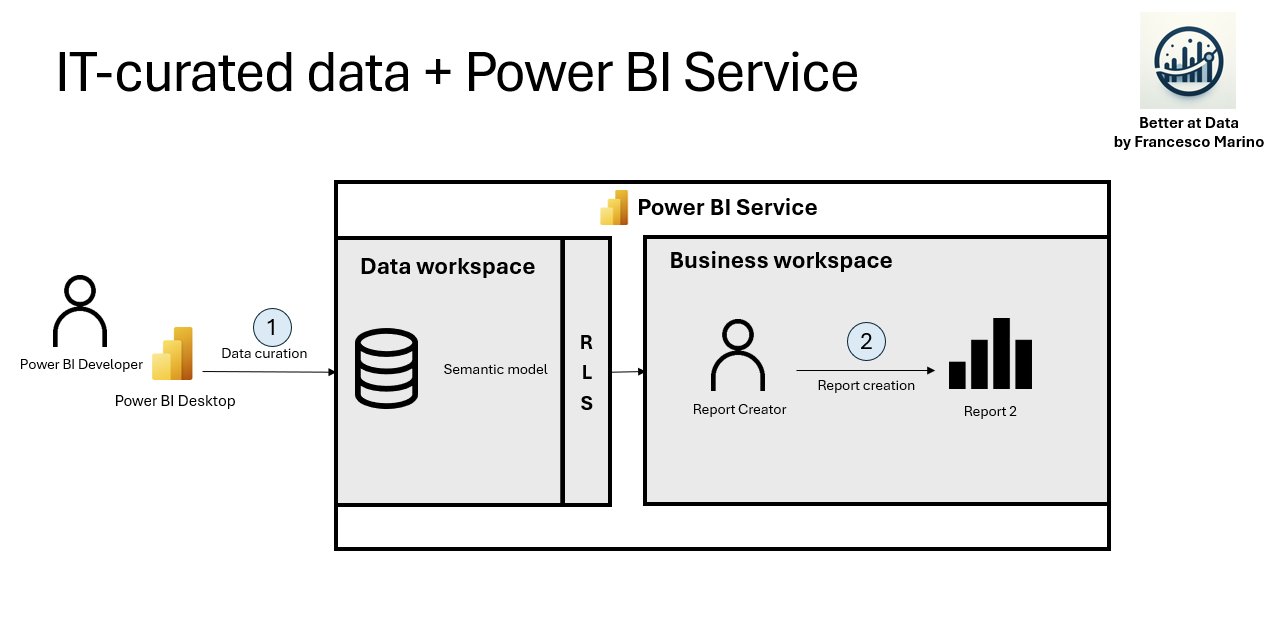
Case 2: IT-curated data and Power BI Service for report creation
This setup is useful in the case the data are curated by the IT team and when the reports are simple enough to be created with only Power BI Service.
From a user experience point of view, this setup is better than in “Case 1” because the report creator develops the report in the same place where he/she normally consumes other reports: Power BI Service. This means that, especially for beginners, there is a more ‘familiar’ experience.
However, I do not suggest this setup because it comes with limitations: even a basic version control is challenging and data analytics without measures is often very limited.
These are all the steps:
The Power BI developer develops a semantic model and publishes it in the “Data workspace”
The report creator uses the semantic model in Power BI Service and creates a new report in the “Business workspace”.
The diagram below illustrates these steps.
To allow this setup I suggest you the following settings on the workspace access management and Semantic model permissions.
The Power BI developer should have:
Member or Admin right in the data workspace
This allows full freedom of sharing semantic models with the required report creators.Viewer right in the business workspace
Needed to understand how data are used and removing any ability to perform changes in a non-IT-owned workspace.
The report creator should have:
Build permission with Row Level Security applied to the semantic model in the data workspace
Needed to be able to consume a semantic model to build a new report.Member or admin right in the business workspace
Needed to create the reports in the business workspace and to share the reports with other users.
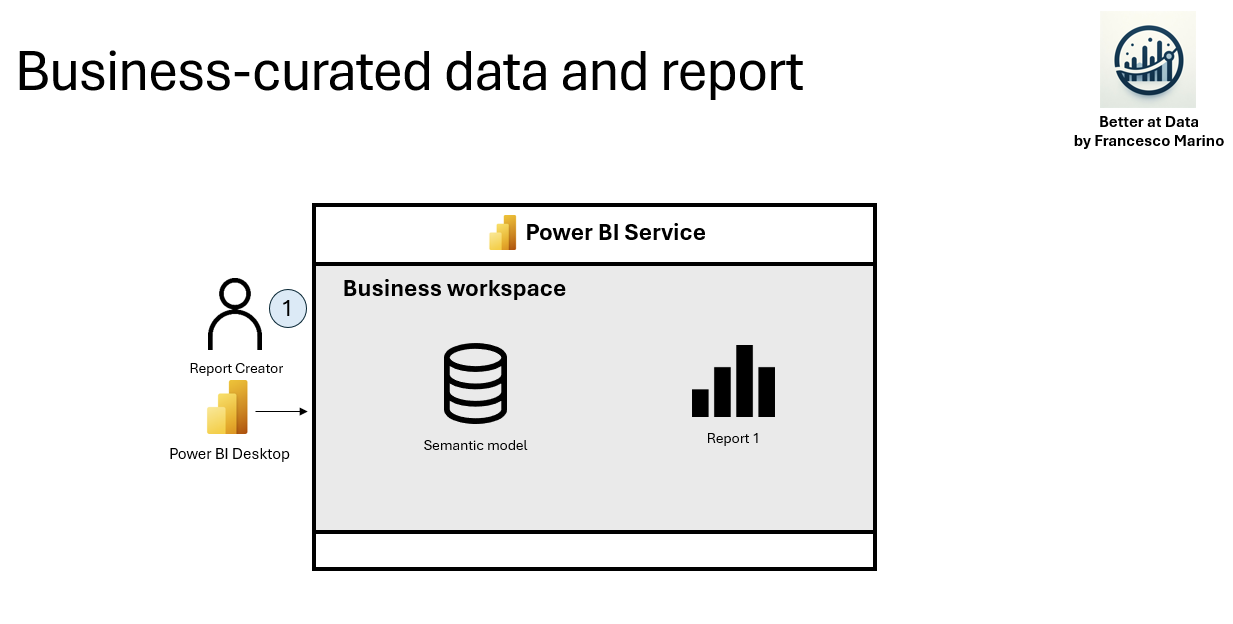
Case 3: Business-curated data
This setup is useful in the case the data are directly curated by the business team. As mentioned, this normally happens when the data are stored in Excel extracts or when there is good technical knowledge and accessibility to data on the business team.
In this case, since the IT team did not curate the data, it is important that, before the UAT phase, the IT team understands the data model. Data modelling is critical in Power BI and making it right the first time is an investment in case of frequently changing reports.
These are all the steps:
The report creator develops a semantic model and a Power BI Report with Power BI Desktop and publishes it in the “Business workspace”.
The diagram below illustrates these steps.
To allow this setup, I suggest you the following settings on the workspace access management and Semantic model permissions.
The report creator should have:
Member or admin right in the business workspace
Needed to publish the created semantic models and reports from Power BI Desktop in Power BI Service and to share the reports with other users.
Summary
In the latest article, we saw how a semi-self-service Power BI model can help to create quicker maintainable reports.
Today we saw 3 detailed ways to structure the report development process in Power BI when business users create the reports.
If you are interested, at this point, you should have all the details to implement this model in your company.
📣I am part of the team organizing the Data Platform Conference Switzerland which will take place on the 25th October 2024 in Zurich, Switzerland.
It might sound like something I should say but… I am honestly surprised by the quality of the sessions and speakers at the conference. I have personally built a part of my career thanks to the content shared by some of them.
Just to name a few sessions:
Chris Webb: What's new in Power Query in Power BI, Fabric and Excel?
Nikola Ilic: 50 Shades of Direct Lake
Injae Park: The Cost of a Workaround - Key considerations for Power BI
…more on the schedule.
🎫If interested you can buy the tickets here
The conference is organized by a nonprofit association, with the goal of making this event a reality. The idea is to support knowledge sharing about data with a focus on the Azure Data stack in Switzerland.

In the next newsletter, we will discuss about some principles that can help improve your relationship with your stakeholders. If you want to hear about a specific topic, feel free to propose it.
In the meantime, you can check the latest articles in the archive.
To the next one,
Francesco
Do you want to give a feedback about Better at Data? 📝Do it here